Digital & Analog Communication
back to design
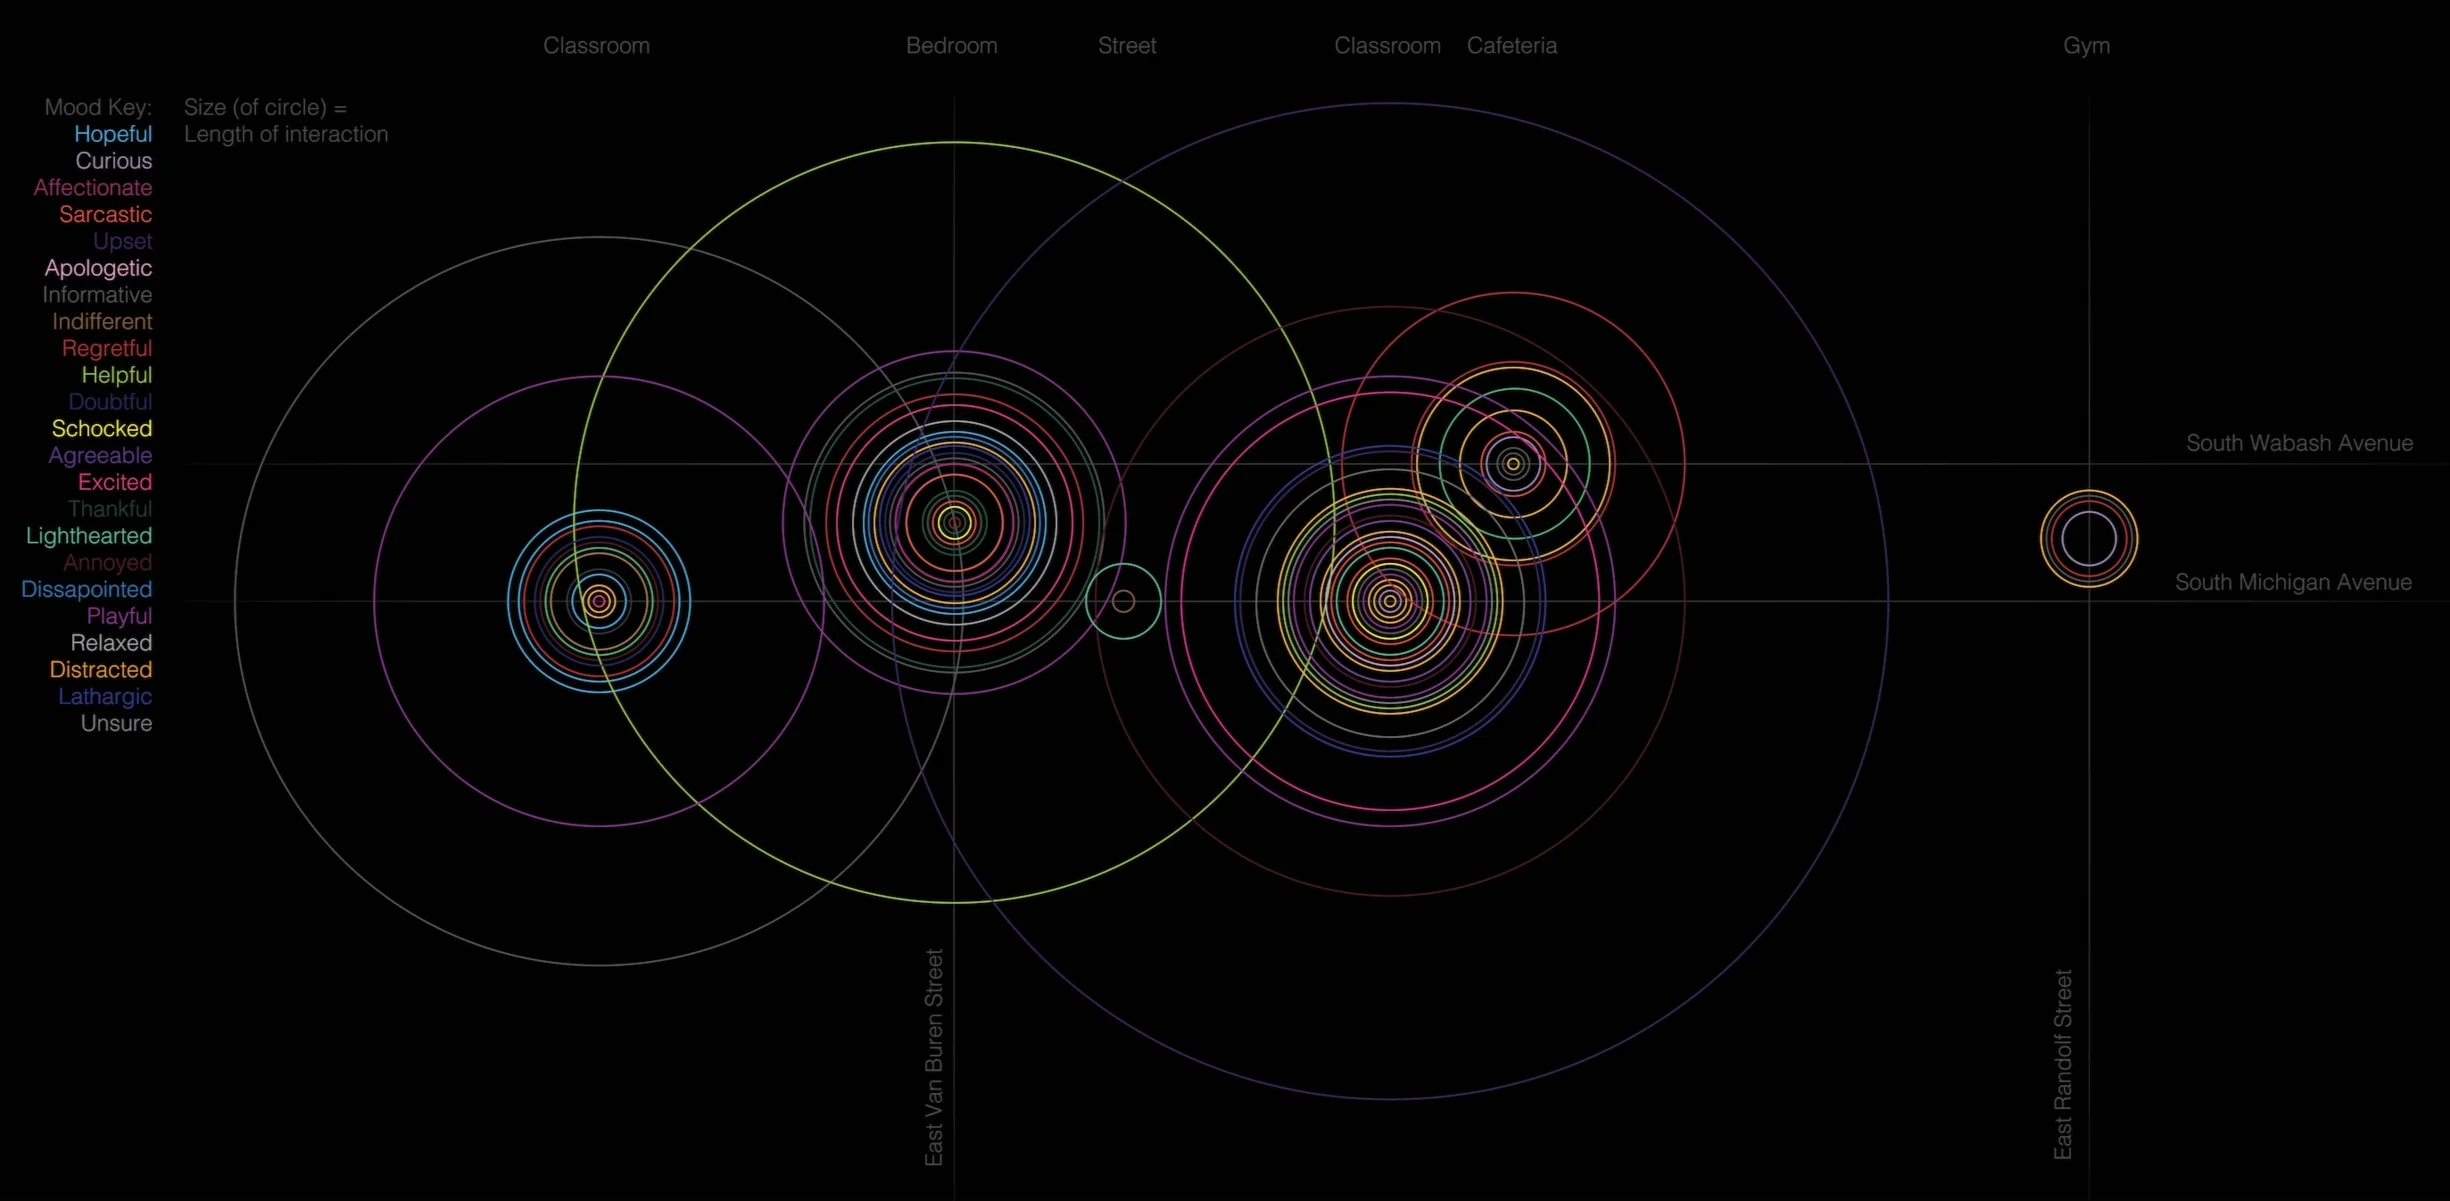
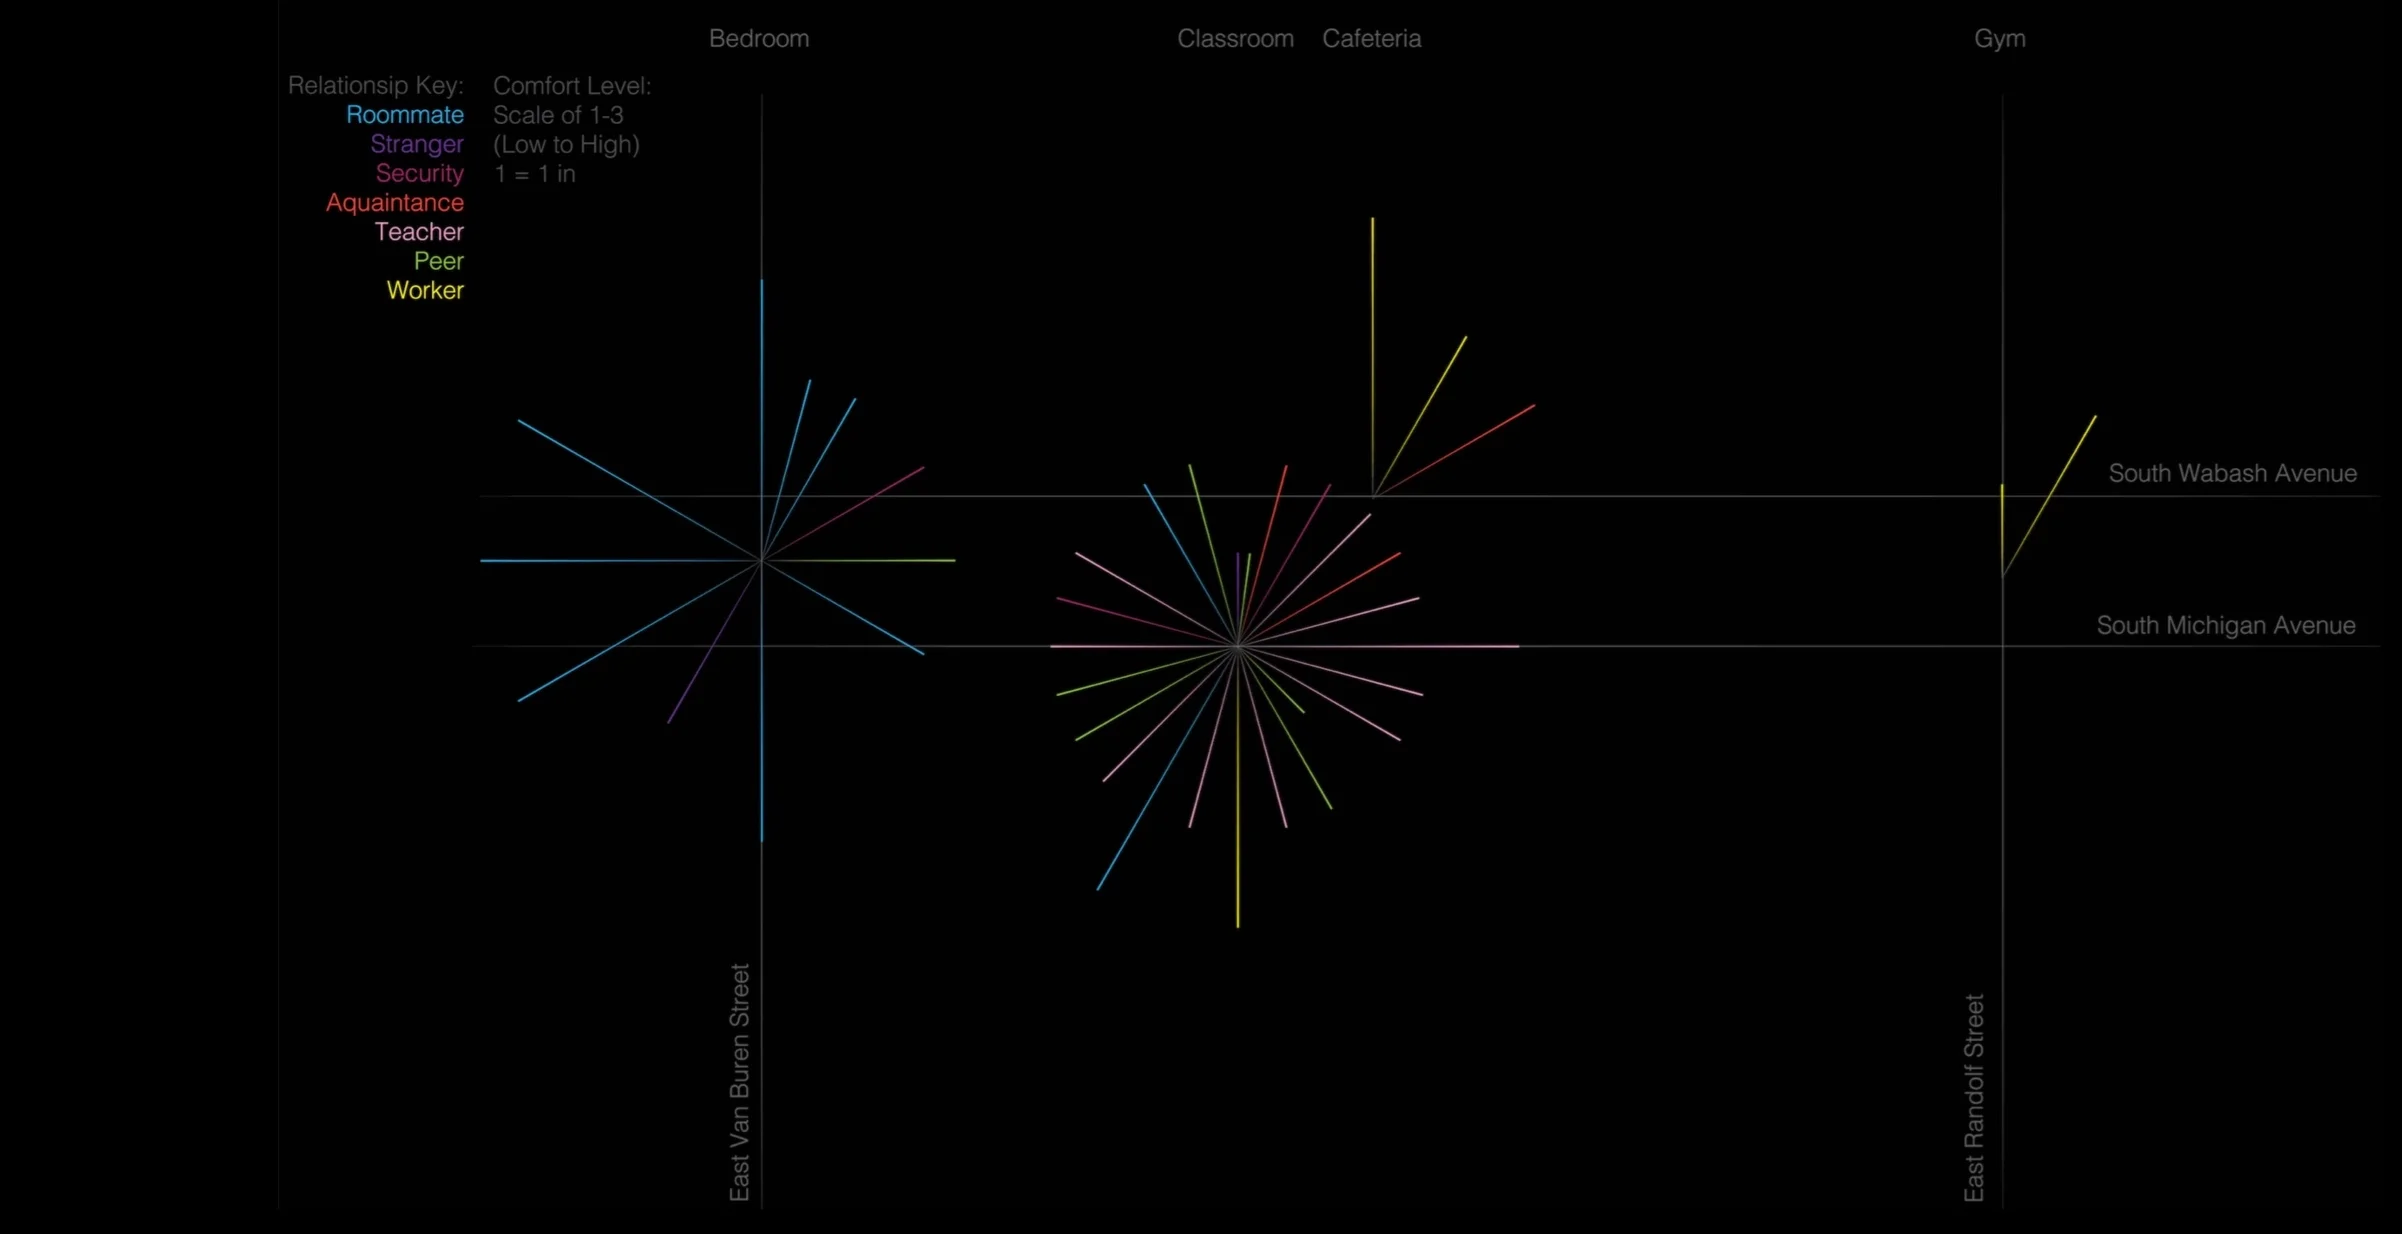
This design is a set of data visualizations depicting my personal record of all analog communications for a period of 24 hours and all digital communications for a period of 72 hours. During the digital recording process, each interaction was sorted according to its metadata, determined by various questions. Are the communications email, chat, twitter, social network sites, listserves, blogs, text messages and phone/voicemail? What types of relationships (immediate family member, close friend, acquaintance, etc.) am I communicating with? What kinds of conversations and data exchanges did I have; were they executables, coordinating a physical meeting, gossip, intimate or humorous...? Are the messages short or long? For the analog recording process, questions included: How do I communicate to drivers and bikers when crossing the street on foot, when ordering coffee in a busy shop, or late at night in a rough neighborhood. I considered both vocal and non vocal communications. Digital interactions are organized in the visualization by location, emotion, and length of interaction while analog interactions are sorted by location, relationship, and comfort level. Both visualizations are color coded according to its relative significance. The act of recording data significantly increased the awareness of my own behaviors as well as offer insight on our reliance as well as repetition in human communication. Recording data and observing its patterns provides a deeper understanding than each of the elements could provide individually.